Nvidia hits a fresh high near $6 trillion, a soft jobs report lifts the S&P 500 to 7,722.72, and
WTI crude falls to $91.11 as the G7 releases diesel stocks
Nvidia closes at a fresh high, market cap nearing $6 trillion
Tesla delivers 486,532 vehicles in the third quarter, beating estimates
Amazon explores moving $8bn of Nvidia chips into an off-balance-sheet vehicle
Plus index closes, top gainers, the Fed path and tomorrow's earnings calendar.
Federal funds rate
Current target range
3.75-4.00%
RaisedWednesday, 16 September 2026
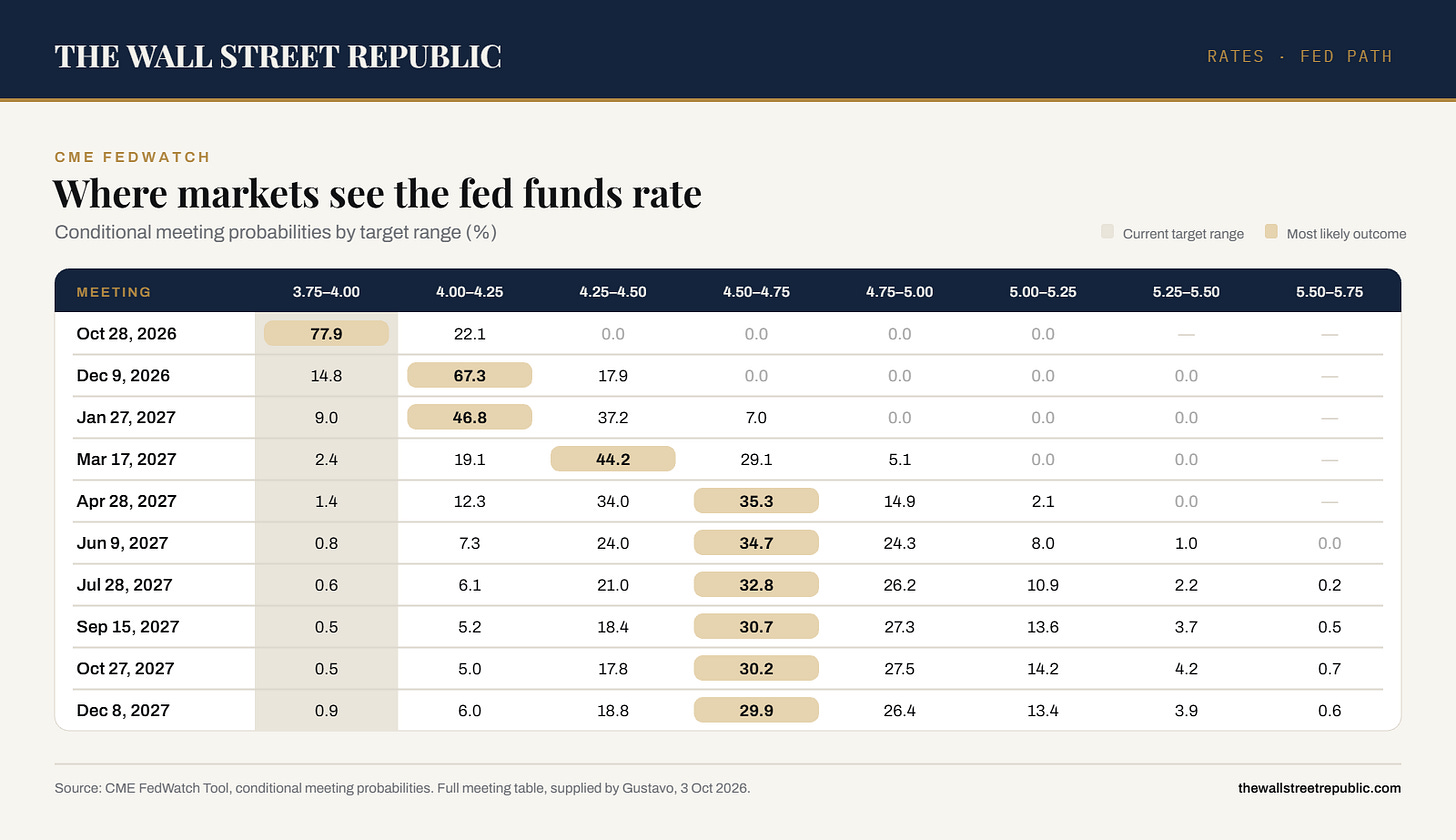
The CME FedWatch Tool's own page showed 77.9% odds the Fed holds its target range at 3.75% to 4.00%
at the October 28 meeting against 22.1% for a quarter-point hike to 4.00% to 4.25%, with no odds
priced for a cut.
The 10-year Treasury yield closed at 5.28%, up 4bp on the US Treasury's daily par curve. The 2-year
rose 5bp to 4.83% and the 30-year rose 2bp to 5.63%, steepening the 2s10s spread to 45bp.
Separately, Tradeweb's own 10-year yield finished at 5.276%, up 4.3bp on the day and 9.6bp on the
week, after an early plunge toward roughly 5.18% on the jobs miss fully reversed as oil recovered,
according to Morningstar and Dow Jones Data Talk.
Why it matters
Market-implied odds the Fed holds rates steady at its October 28 meeting touched as high as 82.8%
intraday right after the payrolls print, according to CNBC, before settling lower by the close (see
below); the intraday round trip in yields shows how quickly that repricing was partly unwound as oil
regained ground.
Open the full tableWhere markets see the fed funds rate: CME FedWatch conditional meeting probabilities, as printed in
the Daily Recap.
Enter your capital, return and time, then add deposits or withdrawals. Results update as you type.
Future value after 20 years
$452,965.15
Initial capital
$10,000.00
Total deposits
$120,000.00
Total interest
$322,965.15
Effective annual rate
10.47%
Capital doubles in
7 years
Interest vs money in
248.43%
Year 20
Money in
$130,000.00Interest
$322,965.15Balance $452,965.15
$453K$226.5K$0
Year 1Year 20
A rate entered per month, quarter, week or day is converted to a yearly rate by multiplying it by the
number of those periods in a year. Deposits and withdrawals happen at the end of each period. Interest
compounds at the frequency you choose. Returns are not guaranteed; this is an illustration, not investment
advice.
What we cover
Equities
Earnings, breadth, sector rotation and the single-stock stories moving the tape.
Rates & macro
Fed, CPI, payrolls and the curve: what is priced and what is assumed.
Commodities & FX
Energy, metals and the dollar, read as inputs to equity earnings.
Policy
Regulation, tariffs and elections, covered as market events, not politics.
How the desk works
Sources and timestamps
Every figure carries its source and the time it was taken.
Analysis is labelled
Reporting and opinion never share a headline.
No paid coverage
No sponsored posts, affiliate links or paid placements.
Positions disclosed
Writers disclose a position in any security covered, or state there is none.